
(Cover photo: Michel Rathwell ; Ce billet est aussi disponible en français)
Bixi Montréal was the first major bike share in North America when it opened in 2009. The technology was sold and the familiar Bixi bikes can now be seen in Toronto, New York, Chicago, Boston, Washington, D.C., London, and many other cities around the world. Bixi’s open data contains information on all trips since 2014 that last longer than 1 minute and shorter than 2 hours, including start/end times and docking stations. There’s a lot to analyze. In particular, I’m interested in how the weather dictates the usage of Bixi. In addition, the City of Montreal has about 20 bicycle counters set up along various bike routes in the city. While this data is a bit less reliable than Bixi’s (several counters have had outages that are not always easy to detect in the data), it’s useful in that Bixi only operates from April 15-November 15. Bike counter data will allow us to see how cyclists react when temperatures drop during the winter.
Much of this analysis is inspired by Todd Schneider’s 2016 post A Tale of Twenty-Two Million Citi Bike Rides: Analyzing the NYC Bike Share System. Todd looked at data from Citi Bike, the New York City version of Bixi, and noted some interesting weather dependence.
Data
I’ve downloaded Bixi’s open data for April 2014 through September 2018, which contains details of nearly 20 million trips. I’ve also gotten the Ville de Montréal bike counter data since 2009. Finally, I’ll be using daily and hourly weather data from Environment and Climate Change Canada, with observations at Montréal-Trudeau airport (CYUL). I’ve uploaded all of the data used in this post as well as a Jupyter Notebook with some key code snippets used for the analysis to Github.
Basic stats
Bixi has experienced huge growth over the last couple of years. For the 2017 season, 80 new stations and 1000 new bikes were added to the system, bringing the total to 540 stations and 6200 bikes. The 2018 season continued this growth, with each month from June to August breaking the record for highest monthly ridership. In this post, I’ll primarily focus on the 2017 and 2018 seasons, which had the greatest number of trips.
Plotted below are the total monthly Bixi trips in the dataset for the 2016, 2017, and 2018 (through September) seasons. We can quickly see how ridership has been steadily increasing if we look at individual months, for example August 2016 (688,174 rides), August 2017 (859,471 rides), and August 2018 (956,792 rides). Note that the official numbers released by Bixi likely include those <1 min and >2 hour trips that are cut out of the open data, so the official values are higher.

We can also group trips into 10-minute blocks to get more precise information. Looking at June through September 2018, Bixi’s peak season, the figure below shows the median trips started during each 10-minute period on weekdays (blue) and weekends (Saturday and Sunday, red). On weekdays, the fewest trips are typically started between 4 and 5 AM, with only around 8 trips starting during each of the 10-minute periods in that hour. We then see a rapid rise in ridership to the morning commute, with a peak 10-minute period of 562 trips starting between 8:40-8:50 AM. Trips rapidly decline until 10 AM, and then a small lunchtime peak appears. Trips then rise steadily through the afternoon. The busiest time of the day on weekdays is 5:10-5:20 PM, with a median of 676 trips started in that 10-minute period. This is followed by 5:00-5:10 PM, and then each 10 minute block from 5:20 to 6:10 PM. So, if you want to beat the Bixi rush, leave any time before 5 PM.
On weekends (Saturdays and Sundays), the pattern is much different. First, note that late-night trips are much more common, with the minimum being a bit later (6 AM). Similarly, the lack of a commute period is evident, with a smooth increase in trips through the afternoon, until the max of 376 trips at both 3:10-3:20 PM and 3:40-3:50 PM.

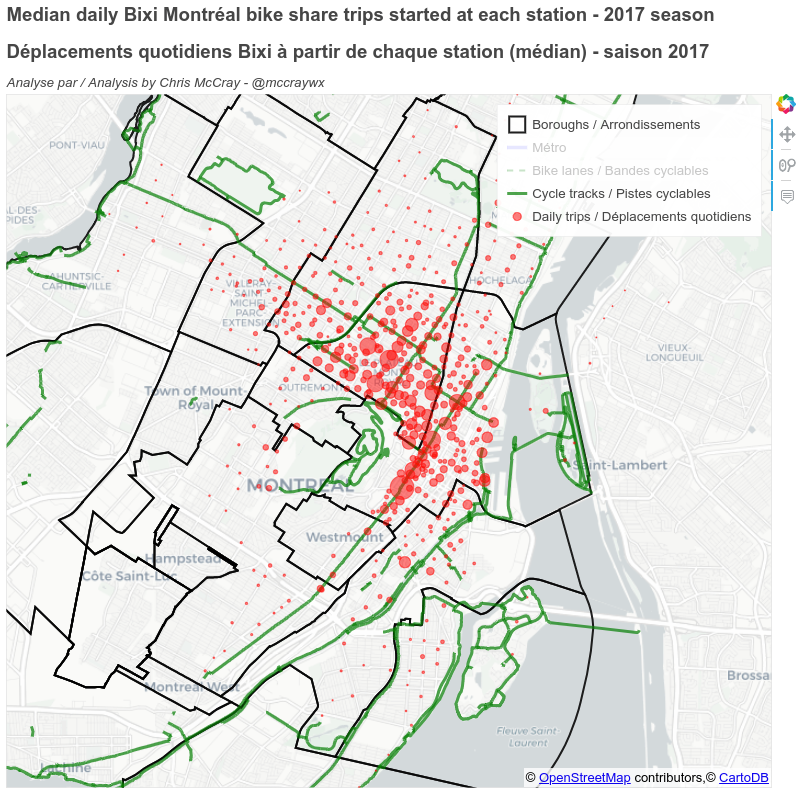
There are lots of neat details to view in the Bixi data. For example, to see which stations were the most heavily-used, check out my interactive map at this link. You can see how the downtown Ville-Marie and nearby Plateau-Mont-Royal boroughs have the highest Bixi usage, and also how Bixi stations along major bike routes like de Maisonneuve are particularly popular.
How does daily weather affect Bixi ridership?
So, now that we have an idea of how Bixi’s ridership behaves, let’s look at the affect of weather on this ridership. Using Environment and Climate Change Canada’s daily and hourly weather observations at the airport (CYUL), we can compare different weather variables with the number of daily Bixi riders.
Temperature
By far, the biggest determining factor in ridership numbers is temperature. Below is a graph of daily maximum temperature on the x-axis, and the total daily riders on the y-axis, for the 2017 and 2018 (so far) seasons. Each blue point represents a single day. We can see a clear, linear increase in ridership as temperature increases. This increase seems to stop once we get warmer than around 25°C.

Daily total precipitation
We might also expect rainy days to have fewer rides than dry days. If we plot the same scatter plot as above, but replace temperature with daily total precipitation, we get the following:

First, you’ll notice the clustering of points on the left, since most days see little (or no) precipitation. There is a clear downward trend as the amount of precipitation increases. However, there are several days that observed >20 mm of precipitation that also had over 25,000 Bixi trips. This suggests the nature of the precipitation on a given day probably plays a big role. We’ll look at that shortly.
Now, let’s combine our biggest control, temperature, with precipitation. Below is the same scatter plot as shown previously for temperature vs. Bixi trips, but now I’ve shaded wet days (where precipitation >0 mm was observed) in blue, and dry days in black.

Here, we can quickly visualize how temperature and precipitation combine to determine Bixi ridership. Cool, wet days have the lowest ridership – note the blue dots with fewer than 10,000 trips. While warm, wet days tend to have fewer trips than warm, dry days, the difference isn’t as extreme as the difference between cold, wet days and cold, dry days.
If we remove the wet days and just look at the relationship between maximum temperature and daily trips for dry days, we can see a very strong, nearly linear relationship (r =0.78). Again,we can see this relationship holds until we get to about 25°C, above which ridership tends to decrease. The two outliers where maximum temperature is above 30°C and ridership is below 25,000 are July 1st and 2nd, 2018. These were particularly hot days, but were also the Sunday and Monday of a holiday weekend, which also affected ridership.

Hourly precipitation
While total daily precipitation clearly has an impact on ridership, we might also expect different effects for a brief, passing rain shower versus a constant rainfall on a given day. We can look at this by examining individual days and comparing the ridership with the median 10-min trips shown previously.
First, let’s look at a day with several hours of rainfall. Below is the graph of trips started every 10-minute period on 21 September 2018 (blue line), with periods of rain from the hourly weather reports shaded in green. For comparison, the same median value plotted in the graph above is plotted in gray. We can quickly see how rain during the morning and evening commutes significantly decreased ridership.

If we look at a day that had just one passing rain shower, however, we can observe a different effect. On 31 July 2017, rain was reported at 3 and 4 PM only. Once the rain began, ridership went to nearly 0, and once it ended the number of trips rebounded nearly back to normal.

What about winter weather?
Bixi only operates from April to November of each year. This means that we can’t gain much insight into how particularly cold temperatures or snow affect Bixi traffic. Luckily, the city of Montréal provides year-round data from bike counters located along about 20 bike routes in the city. Bike counters have been added and removed since the dataset began in 2009. For the analysis here, I’ve focused on 7 counters with consistent, reliable data for 2015-2017: Parc, Pierre-Duplessis, Côte-Sainte-Catherine, Brébeuf, Notre-Dame, Boyer, and Saint-Urbain. This dataset contains daily counts at each counter, so we can’t see the hourly detail like with the Bixi data. Still, we can produce a similar graph of daily maximum temperature vs. total bikes counted at these seven locations.

Here, we observe essentially the same trend as with Bixi, but since we have data during the winter months, we can see what happens at very cold temperatures. First, we note that when high temperatures are between around -10 and 0°C, the number of cyclists is low, but non-zero, and the difference between -15°C and -5°C is quite small. This seems to show that a large portion of those who do cycle in the winter tend to tough it through even the worst conditions. An analysis of winter cycling by Éco-Compteur, the company that produces the counters, also found that 70% of winter cyclists were out during the biggest snowstorm of the 2017 season, and 65% of them were out on the coldest day of the year. Once temperatures rise above 0°C, a rapid increase in the number of cyclists occurs until, as we found with the Bixi data, temperatures rise above about 25°C.
Conclusions
This data shows us first that the key factor in the number of daily Bixi riders and cyclists in general is the maximum temperature. While I didn’t show the analysis for daily minimum temperature here, its effect is similar but not quite as large as that of the daily high. Between 0°C and 25°C, the number of cyclists on the streets of Montreal increases linearly, before starting to drop off at hotter temperatures. Wet days, as expected, have lower ridership than dry days. Precipitation, however, must be examined alongside temperature. Warm, wet days still have much higher ridership than cold, dry days.
This type of information would allow us to develop a very accurate model of Bixi ridership on a given day using only a few variables. As a simple demonstration, we can estimate that for a dry day with a maximum temperature between 0°C and 25°C, the number of Bixi trips increases by about 1,000 trips per 1°C of maximum temperature increase. A roughly similar relationship exists for the total counts at the 7 bike counters I previously mentioned.
We could of course look at many more variables here. If you’re interested in more, check out the link to the data and code below!
Data and Python code
I’ve made all of the data used here (Bixi, bike counter, and Montréal weather data), as well as some code snippets used to produce the analysis and graphs, available on Github. Feel free to apply this code to other bike shares with similar open data to see how weather might affect them differently, and let me know if you have any questions!
Very interesting article.
Thermal stress on a person includes temperature and humidity. It might be interesting to look at the relationship between ridership and the humidex level to see if you get a finer correlation.
Thanks! It would certainly be a good idea to add in humidity information, which is available in the hourly weather reports. Like you suggest, the correlation would probably be slightly stronger between maximum humidex and rides/day, for example, than just max temperature. Something to keep in mind for an updated post.